Meiro product updates: reporting dashboards
“Data-driven decision making” (DDDM) is getting more important these days, especially in the frequently changing times. But how do we achieve it? How to make data less scary for non-data teams? How do we make it useful without overloading it?

CPO | Co-Founder of Meiro

“Data-driven decision making” (DDDM) is getting more important these days, especially in the frequently changing times. But how do we achieve it? How to make data less scary for non-data teams? How do we make it useful without overloading it?
One of the 10 points described by Harvard Business Review for putting DDDM strategy in business is choosing the right metrics that matter and solving the access to data across the company. Meiro solves both. With Meiro, we offer customizable analytics tailored for each business. Not sure how to measure your success? Lost in the data you have and not sure how you can utilize it practically? No problem. The Meiro team is here to help.
Besides segmentation, single customer views, clever identity resolution algorithms, and other essential features, Meiro offers reporting dashboards in the product.
Dashboards are different for each client, depending on the data you need and the data you have.
Why is it all so unique with Meiro? As Meiro collects & connects data from various data sources, it offers more profound insights into what is happening. On top of it, collecting 1st part data with Meiro is especially important in the 3rd party data apocalypse times. (check this out)
“We are closing the stack” from the top end by adding full data visualizations and reporting layers. Use your integrated data, build or let us help you create bespoke reports (and here are a few examples but by all means, they are not all). P.S. Do you still need your CDP data in Tableau, Qlick, Yellowfin, etc. ? absolutely no problem; plug in your CDP database, all this flexibility just for you.
Let’s have a look at some examples below
**Know your revenue:**It is often essential to know the numbers of transactions across the time (online & offline merged), distribution of various product categories that have been bought, and predicting what product customers may accept. It helps to see where to invest marketing budget wisely and save & spend money.
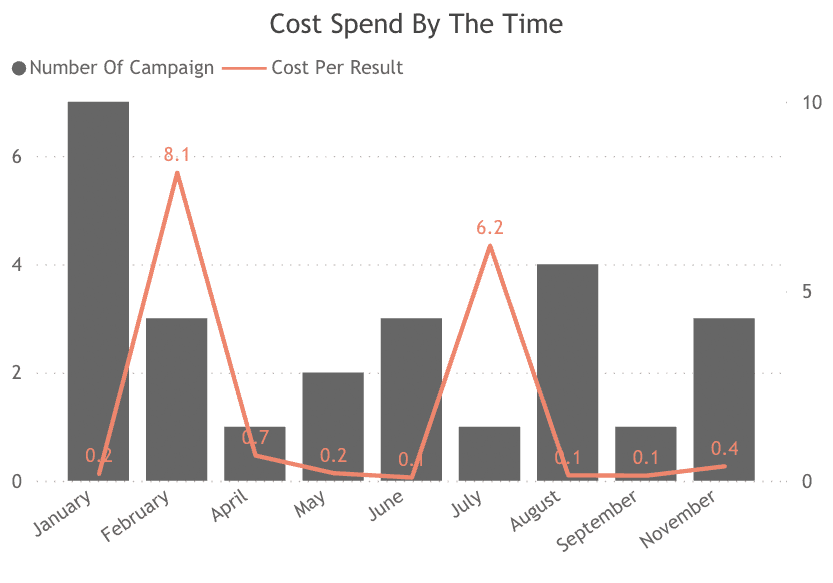
**Know traffic around your brand:**On top of it, observing traffic and customer interactions helps see the results of all the marketing efforts. Is your campaign driving sales? Or just an empty click?
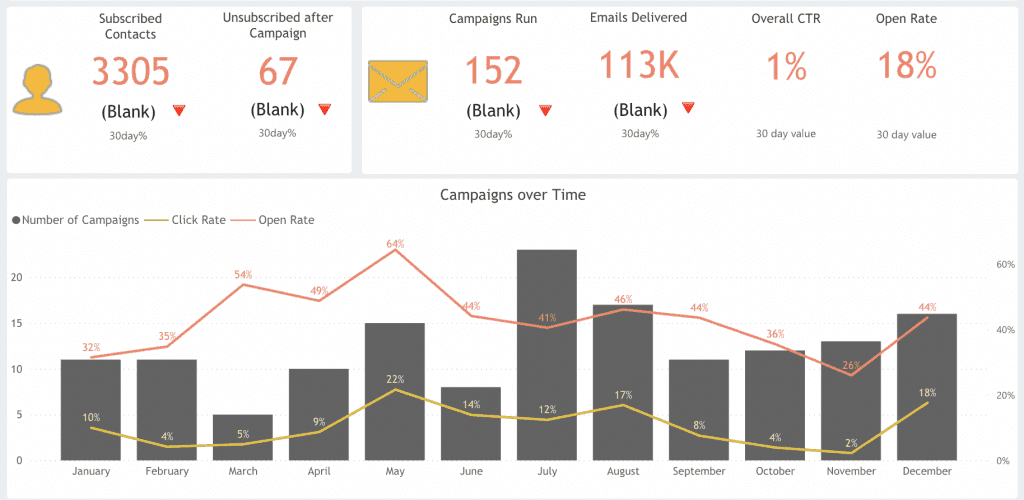
Engagement vs. revenue: Not sure which channel your customers engage with the most? Which product drives the highest revenue? The most increased traffic around the product does not mean that it generates the highest revenue or ROI. Do you invest your marketing budget in the right place?
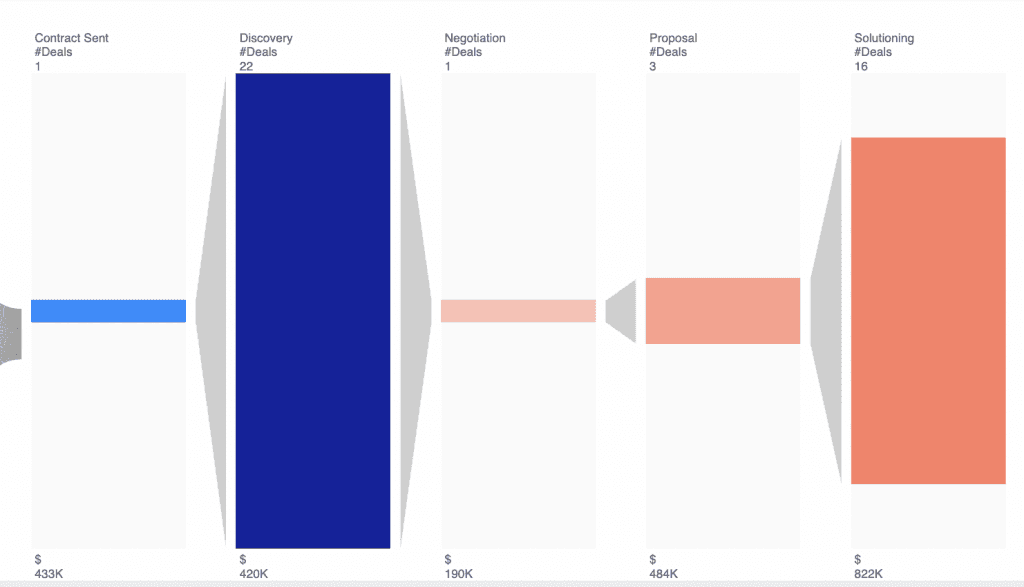
Customer journey: How many of your customers know your brand but have never made a purchase? How many purchased but never came back? What about your loyal customers? How many of them do you have? What are their spending habits?
 Know your customers well: How much do you know about your customer experience? What can you learn about your marketing strategy from it? Segment performance: Finally, check out how your segment is performing. How it grows or shrinks. Check this all out. That is just the tip of an iceberg with far much more to explore. Curious? Let us know!
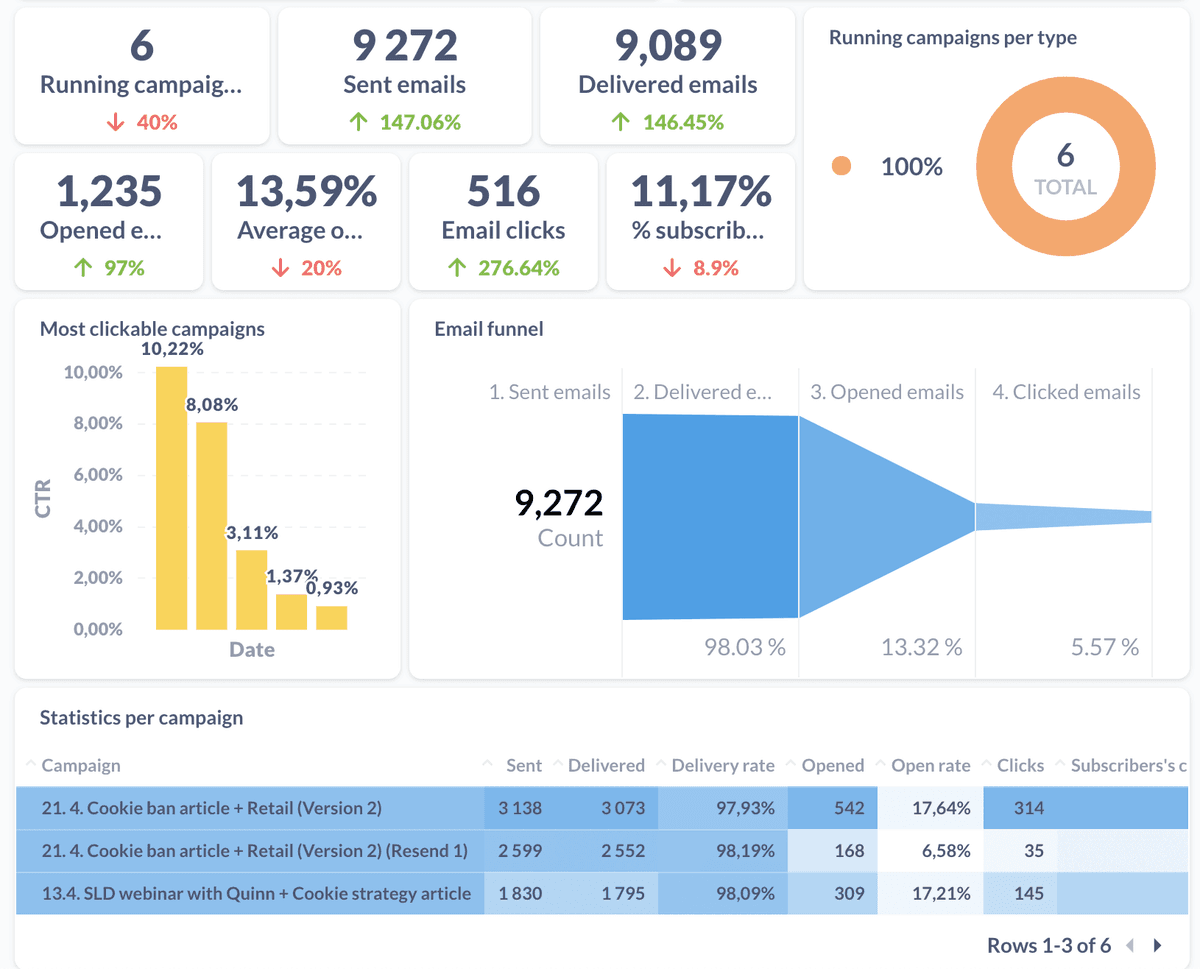
Table of contents
Let’s have a look at some examples belowUnleash the full potential of your customer data. Let’s talk!
Spread the love:

Pavel stands behind all the smooth operations and business growth. You would run into him in the queue at airports rather than in one place. Besides that, he enjoys chess, boxing, and history.


